Gazing optimistically into the future, Mayor John B. Hynes declared on June 25, 1959, that the opening of the Southeast Expressway ushered in “a better Boston.” A freeway that could handle 50,000 cars a day, he said, met “one of the modern challenges of our times.”
How quaint that sounds today.
Hynes may have been right in the moment, but he couldn’t see the hellscape that was coming. Even with added lanes, that same highway gagged last year on a daily average of 200,000 cars. And more keep coming by the day, afflicting Boston with some of the nation’s worst congestion.
Boston’s current traffic obsession is not hyperbole: The metropolitan region has 300,000 more cars and trucks than it did five years ago, according to an analysis of state data. Congestion has crippled every major commuting thoroughfare, from the south, west, or north. Some morning drives have doubled or worse, dooming drivers to thousands of hours a year lost to staring at the red river of taillights ahead and wondering why.

The jam-and-cram has a host of collateral effects. Stalled traffic is traffic polluting in place — ask the people of Chinatown, bounded by the Mass. Turnpike and Southeast Expressway and afflicted by the region’s worst tailpipe fumes. Delivery vans, school buses, and hospital shuttles struggle to get there from here. During the evening rush, key MBTA buses have slowed to near 8 miles per hour, a pace so atrocious it would have trouble qualifying for the Boston Marathon.
The nation’s oldest subway system doesn’t make it easy to give up your car. The Red Line train that barreled off the tracks in June was built in 1969, making it nearly two decades older than half of Boston’s residents. The system has suffered about 40 derailments in the last five years, more than almost any metro transit system in the country.
The suburban commuter rail can be just as frustrating. During that merciless winter in February 2015, two out of every three trains ran late.
It is a truism but transportation makes city life work — or pushes it to the brink. People need to get to their jobs and back home to places they can afford to live.

But as Boston’s economy revs higher, that fundamental linchpin of city life is failing. More jobs have concentrated in the urban core and pushed the skyline higher, drawing ever more commuters into the Boston traffic maelstrom. In the last five years, Suffolk County — which includes Boston but not Cambridge — has added 74,000 jobs, a surge in employment that represents 1 out of every 4 new positions in Massachusetts. In the city, 31,000 more cars with resident stickers fight for on-street parking than just over a decade ago.
People can no longer reliably navigate a region cursed by its own success. For too long, federal, state, and city leaders were fixated on that same car-centric vision of the future as Mayor Hynes in 1959.
The question is now front and center: Can Greater Boston continue to thrive — or even function — without fundamentally rethinking its relationship to the car?
And the answer is as inconvenient as it is true: Not for long.
The Globe Spotlight Team queried a thousand commuters, surveyed more than a hundred lawmakers and the region’s largest employers, and analyzed data from over 758,500 ride-share and delivery trips with the help of the transportation analytics firm StreetLight. In addition, Spotlight team members examined thousands of public records, rode in driverless cars, and followed a delivery truck stuffed with Amazon packages as it parked illegally, time and again, squeezing traffic on Boston’s narrow streets. The team interviewed drivers, transit riders, and bicyclists, and reporters traveled across the United States and abroad to study transportation initiatives in other cities.
All told, the findings were unmistakable: Greater Boston has vastly outgrown its roads but the car remains king. That is as true for drivers — 1.7 million of whom drive to work alone — as for the public officials who would have to act aggressively to change this picture and show little will to do so.

Despite rhetoric encouraging constituents to drive less, many of Greater Boston’s most influential elected officials cling to a fundamental car-first mentality that has formed the foundation of public policy since post-World War II America. Maybe it’s no wonder; the perks of government skew heavily toward the car, rewarding the region’s most powerful politicians and many of their most influential staffers with free and coveted government parking spots in central Boston.
Other metropolitan regions have taken steps — some bold, some small but effective — that have reduced car traffic, enhanced mass transit, especially buses, and curbed noxious emissions.
In the last five years, 59,000 more people began driving alone to work in Greater Boston.
But not in Greater Boston, where the blame for our car-first culture extends beyond elected officials or the entrenched political establishment to corporate boardrooms and, in the end, to each of us. Ultimately every time we get behind the wheel, we must come to terms with a simple truism: We are traffic.
And we are stuck in place.
A snapshot of our problem was obvious one evening rush hour in May. Globe reporters counted nearly 650 cars in an hour flooding north into the Tip O’Neill Tunnel. In nearly 7 out of 10 of them, the driver rode alone, the only sign of other humanity being the occasional cluster of dry cleaning hanging from a hook.
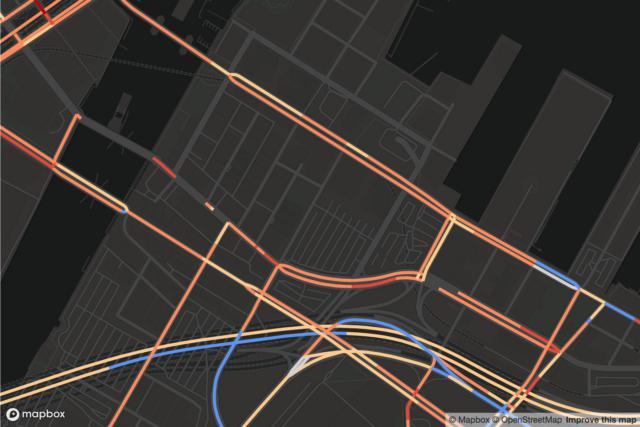
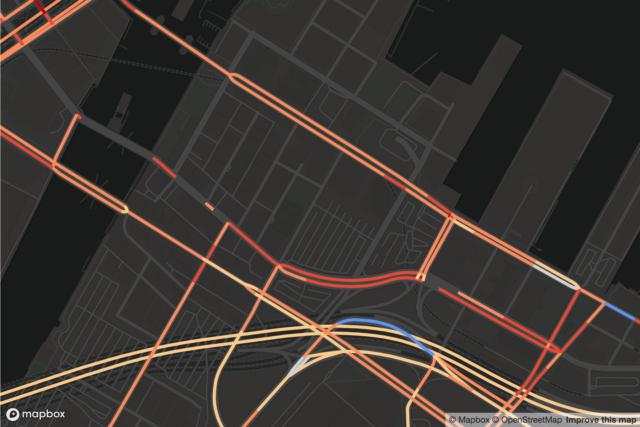
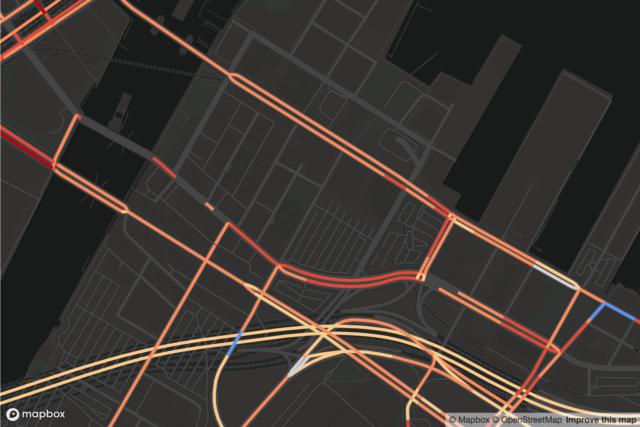
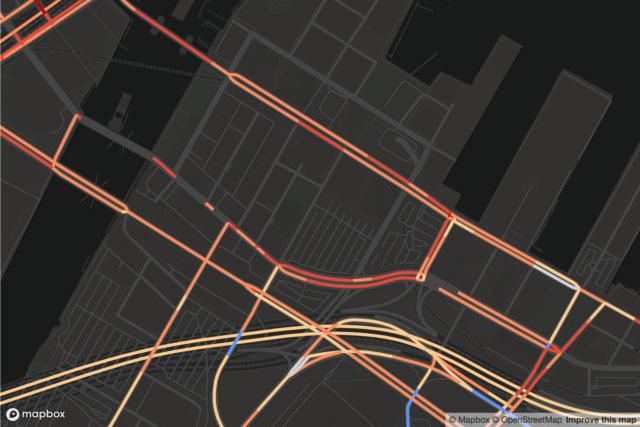
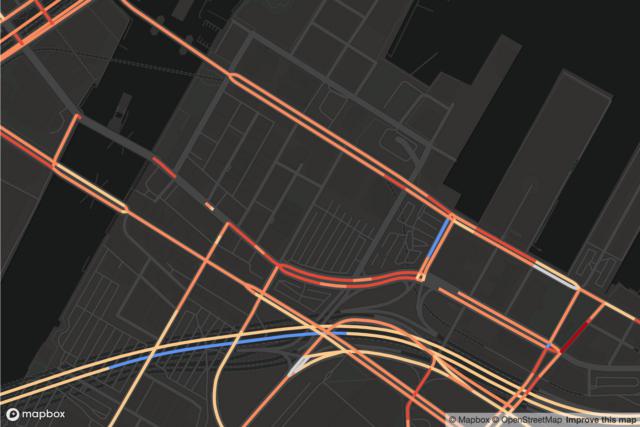
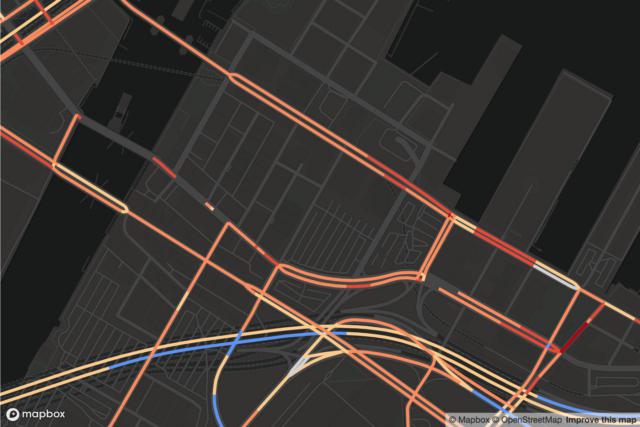
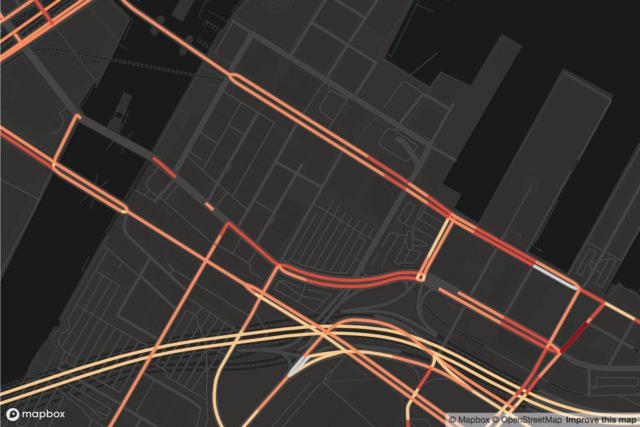
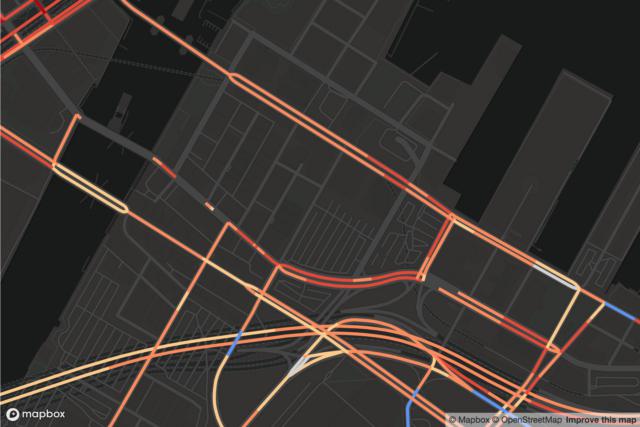
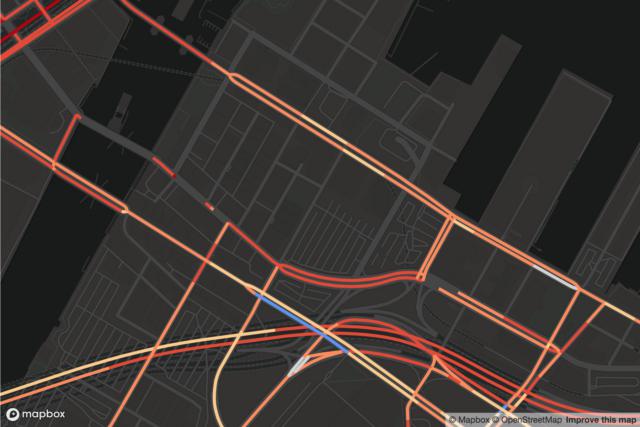
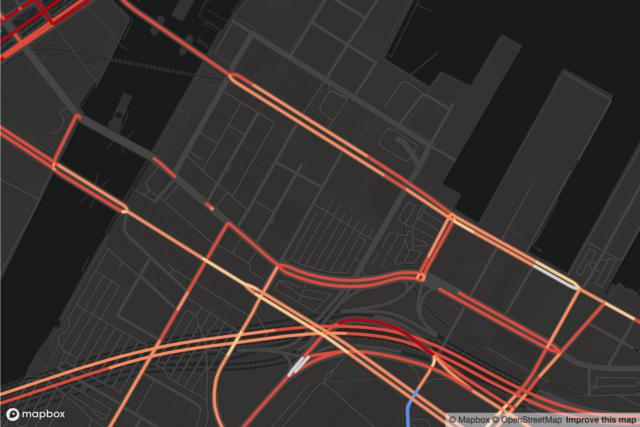
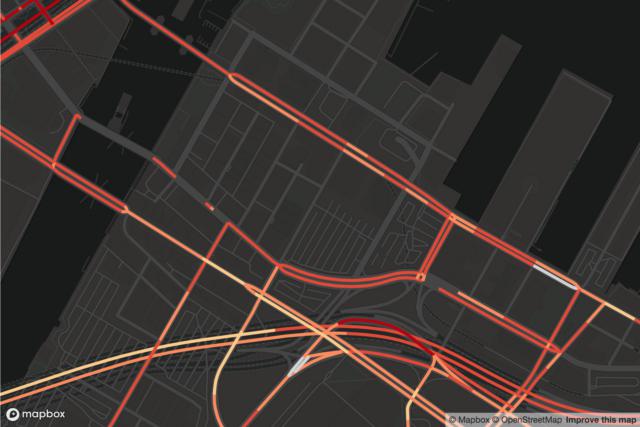
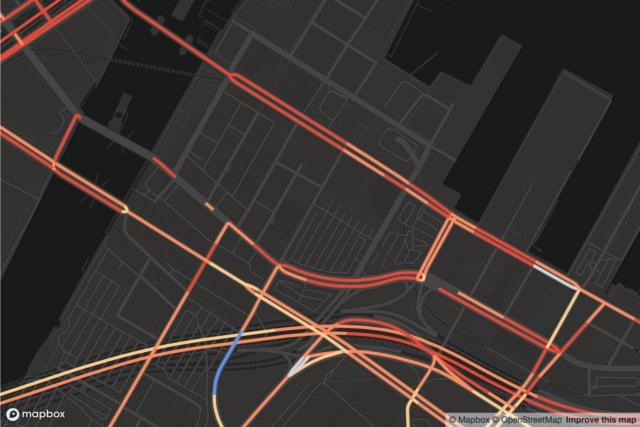
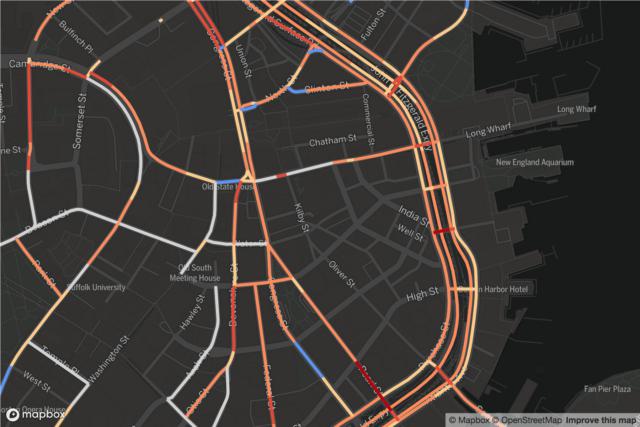
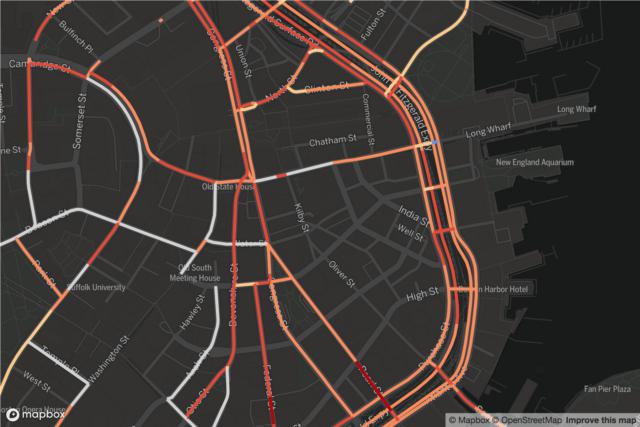
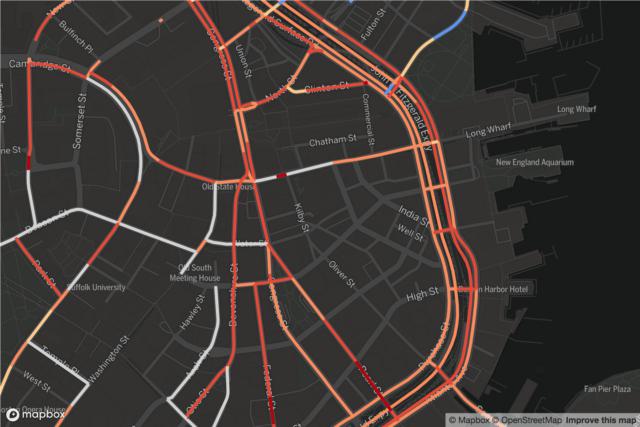
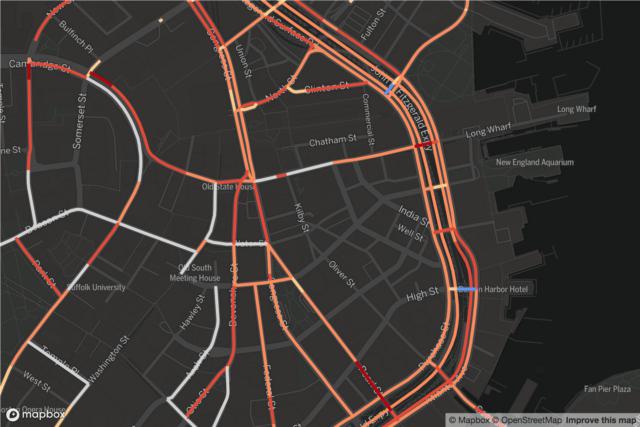
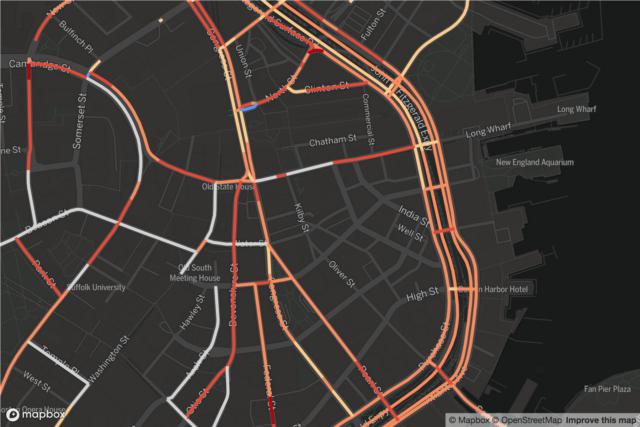
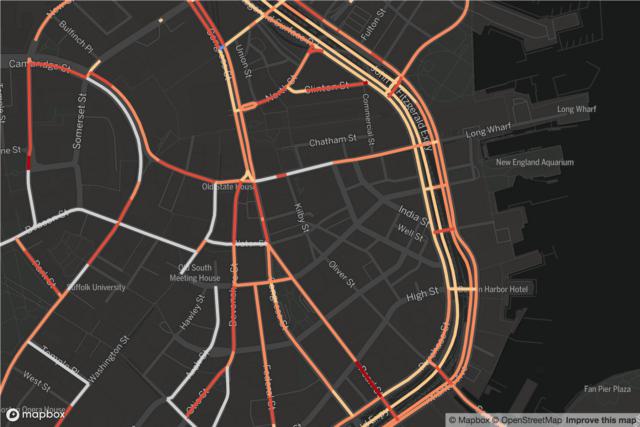
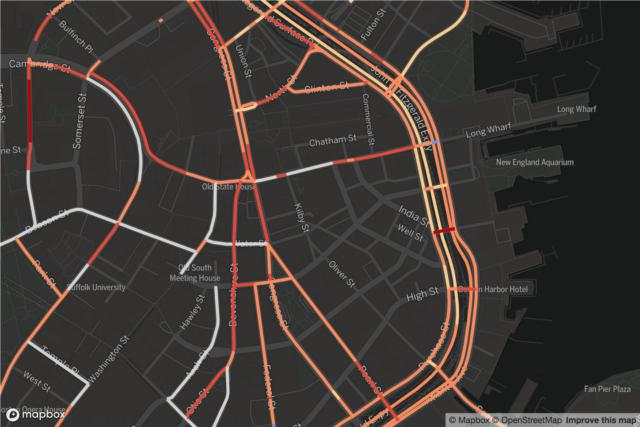
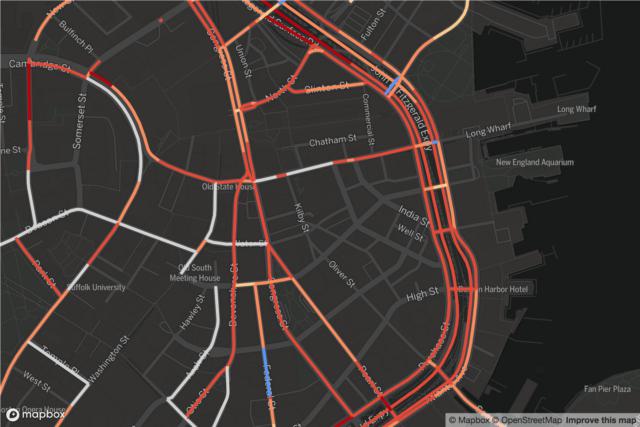
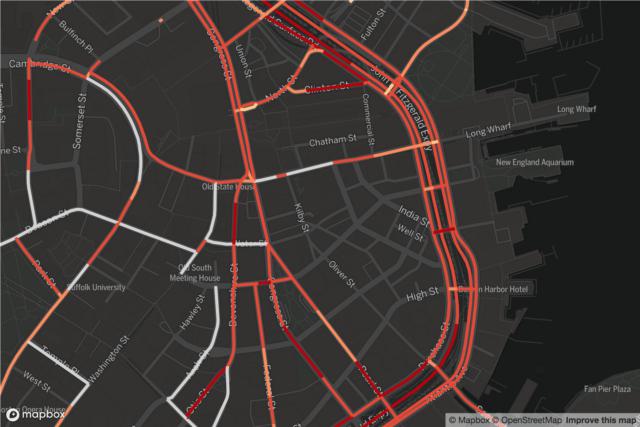
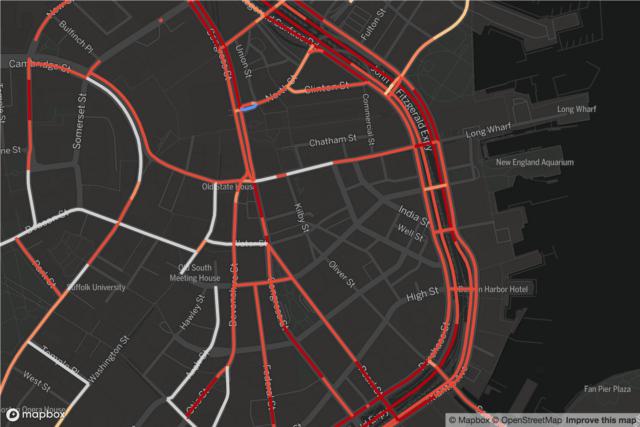
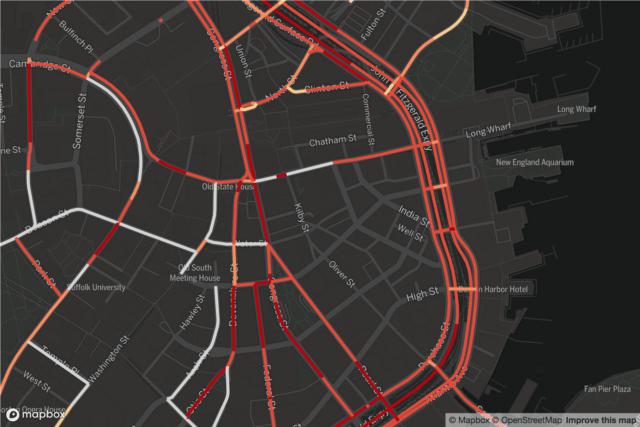
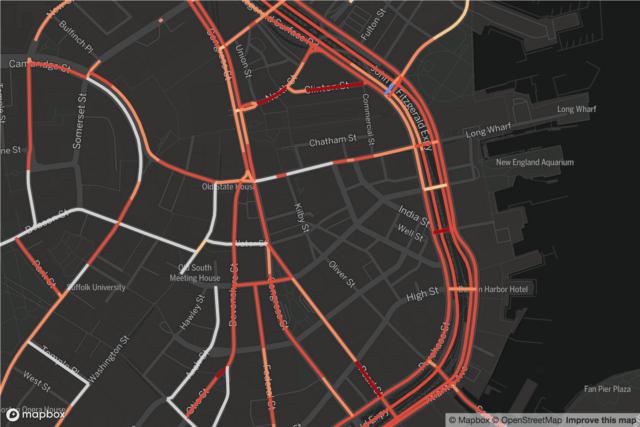
The infuriating crawl
Some of the clogged roadways of Boston
Seaport
Summer St
Seaport Blvd
Mass. Pike
Institute of Contemporary Art
Downtown
City Hall
Atlantic Ave
State St
Long Wharf
Explore traffic in neighborhoods in and around Boston
Choose a time:
Source: StreetLight. Details about the company’s methodology located in a note at the bottom of the story.
Saurabh Datar/Globe Staff
POLITICAL LEADERSHIP KEEPS CARS FIRST
Politicians, like those they represent, tend to be wedded to the status quo, to the world we know. Change is comparatively risky. A decade ago, Governor Deval Patrick found that out when he pushed the first gas tax hike in nearly a generation. Lawmakers killed the proposed 19-cent increase as the then-state Senate president dismissed the governor as “irrelevant.”
Patrick got his head handed to him – by fellow Democrats.
Inaction and half measures have been the result. Now by almost every metric, Massachusetts is moving in the wrong direction — barely moving at all, in fact — on efforts to reduce congestion. In the last five years in Greater Boston, 59,000 more drivers commuted alone. A study released in February found Boston had the nation’s worst rush-hour traffic.

In the unchallenged ascendancy of the automobile, our elected leadership is very much part of the problem or, at the least, part of the culture. Most days, those leaders drive — or are chauffeured — to a government parking spot. A Globe survey of 134 state and municipal lawmakers and officials found that 85 percent take a car to work and less than 7 percent reported having monthly transit passes.
The Globe contacted all 200 members of the Legislature, the six constitutional officers (five drive alone), and 29 municipal officials in the MBTA’s core service area. Just over half of the 206 state elected officials responded – and only five of them reported having an active transit pass.
Consider that every member of the Legislature — no matter how close they live to the State House or public transportation — has access to parking on Beacon Hill, where spaces are rare and ruinously expensive for most everyone else.
The same holds for Governor Charlie Baker and Mayor Martin J. Walsh. The perk is free except for a bite taken by the Internal Revenue Service, which considers some of the value of free parking taxable income.
But the benefits of elected office go beyond parking. At least 40 current and former officials have leased cars through their campaign. In the past two decades, politicians have used at least $4 million raised from political donors for cars, gas, tolls, Ubers, and more, according to a review of the database maintained by the state Office of Campaign and Political Finance.
How much did they spend on mass transit? Less than $30,000 went for MBTA tickets, according to a Globe analysis of campaign spending.
At the State House, lawmakers already receive taxpayer-funded commuting allowances worth $15,000 to $20,000, depending how far they live from Beacon Hill. Campaign finance regulations prohibit lawmakers who accept the allowance from double-dipping.
“If the [commuting] allowance is accepted,” reads guidance from the Office of Campaign and Political Finance, “a legislator may not also use campaign funds to pay for expenses relating to the commute.”
However, there is a loophole: Lawmakers can commute in a campaign car if they pay back their political account 58 cents a mile.
State Senate President Karen E. Spilka, a Democrat from Ashland, receives a $15,000 commuting allowance and lives a mile from a commuter rail station. Since January she has spent $9,500 of her campaign money to lease an Audi Q5. (Spilka’s staff said she reimburses her campaign appropriately for commuting in the Audi and has taken commuter rail “at least twice (round trip) in the past few months.”)

The same goes for House Speaker Robert A. DeLeo, who lives in Winthrop and could commute via bus and subway. But records show the Democrat takes the annual $15,000 expense stipend even though his campaign leases the car he commutes in. (DeLeo staff said he also reimburses his campaign).
Over the last 13 years, DeLeo has spent more money from campaign donors on driving than nearly any other lawmaker: $115,000 to lease Fords, $22,000 on gas, $10,000 on tolls. DeLeo declined interview requests.
As governor, Baker has never pretended to personally embrace the Massachusetts Bay Transportation Authority, which he oversees. Living a 10-minute walk from the Swampscott MBTA Station, Baker is driven to the State House. The Republican has never ridden the commuter rail as governor and did not ride the subway until a media event in September, more than 1,700 days after taking office.

His travel habits are mirrored, in part, in his transportation priorities. Baker has opposed, rejected, or undercut most tax or fee hikes that would make it more expensive to get behind the wheel.
Baker has overseen two transit fare increases, but drivers have not been asked to pay more. All car costs — tolls, registration and driver’s license fees, and inspections charges — have remained frozen since he took office in 2015.
Baker has made significant and long overdue investments in the subway system and commuter rail after a series of catastrophic failures nearly ground it to a halt in the winter of 2015. The administration has also approved a plan to someday make the commuter rail run almost as frequently as the subway, and it has pushed a regional effort to curb greenhouse tailpipe emissions that could increase wholesale petroleum prices — and eventually costs at the gas pump.
How we get around
Of the 2.6 million commuters in Greater Boston,* the overwhelming majority drive alone to work.
Among transit riders, the MBTA tallies more than 1.2 million rides each weekday, with the majority on the subway.
*A region stretching from southern New Hampshire to Plymouth County, encompassing much of eastern Massachusetts.
Sources: American Community Survey for 2018, Massachusetts Department of Transportation for fiscal year 2018
Patrick Garvin/Globe Staff
As a candidate, Baker adamantly opposed linking the state gas tax to inflation, and the fee has remained flat at 24 cents a gallon — a levy half that of some states. And when it comes to cars and congestion, new ideas often die on Baker’s desk. He vetoed two pilot programs that could get people to rethink their driving habits, including lowering tolls during off hours to encourage drivers to avoid the rush. Among the nation’s top 10 metropolitan areas, Greater Boston is one of only two that does not have some form of variable tolling.
This project was possible because of Globe subscribers. If you don’t subscribe yet, please support our work here.
Subscribe nowNone of the ambitious ideas tried by other high-congestion states have seen a clear lane here. Even small potential solutions languish in the tangle of state government, such as the push by the Merrimack Valley Planning Commission to allow buses to drive on highway shoulders, giving faster access to Boston. This is not a radical idea: At least 14 cities and counties across the nation allow buses to drive on shoulders to escape car traffic.
It’s not that the Baker administration is unaware of efforts to rein in traffic. It is studying the potential here for managed express lanes, which essentially allow solo drivers to pay to use the carpool lane.
Yet, the administration has also issued statements critical of more aggressive efforts in such cities as London — statements that included information that was sometimes misleading or just plain false.

In an interview, Baker defended his approach to the congestion crisis and stood firmly behind his characterization of initiatives in London. The governor said that after investing billions in the subway and commuter rail, he has done more to offer people alternatives to driving than “most administrations that came before us.”
But Baker also made it clear he will only go so far to get people out of their cars. When asked if his administration would discourage driving by making motorists pay more, Baker did not answer directly. His focus, he said, is to encourage people to take the train or bus by making public transportation better — not by making driving more expensive.

He cited the number of railroad ties his administration has replaced (250,000) and the number of trips added to the commuter rail (10,000). Regardless of those efforts, trends on Greater Boston roads keep moving in the wrong direction – more cars, more driving, and more traffic. Asked whether the state should examine bolder steps taken elsewhere, the governor said transit projects take time.
“Much of the work that we’ve been doing here is going to start landing over the course of the next two, three, or four years,” Baker said. It “should provide people with a lot of options that are not currently available to them, which I believe will make a big difference.”
Baker’s transportation secretary, Stephanie Pollack, made no apologies for their methodical approach.
“I don’t see incrementalism as an insult,” Pollack said. “I see it as how you actually change things.”
Pollack said the state would not consider one bold measure — imposing tolls to enter downtown — unless Boston City Hall took the initiative. She said in August that the state is not exploring these type of tolls because “the city of Boston has not indicated an interest.”
Federal policy overwhelmingly favors cars, Pollack said, but she rejected the suggestion that the Baker administration shared the same car-first mentality. She cited a national survey that found, at $292 per resident, Massachusetts spent more per capita on transit in 2017 than any other state.
“We spend on transit,” Pollack said, adding that it is their top priority. “Now, you can still have a debate on whether that’s enough and whether we should spend more, but I have to say, the argument that we disproportionately support cars?”
Pollack shook her head dismissively.
“People want congestion to go away yesterday,” she said. “We need to divide the world into the short term, the medium term, and the long term. And honestly, I’m focused on what we can do in the short and the medium term.”
LESSONS FROM LONDON AND STOCKHOLM
In London’s teeming financial district, Andrew Craig stood on the edge of a five-way intersection and marveled. It was 5 p.m. on a September Tuesday and professionals crammed the sidewalk, scurrying into the subway station named for the Bank of England.
What impressed Craig were the roads — nearly empty expanses of black asphalt at the height of rush hour. As traffic lights changed to green, red double-decker buses streamed past along with swarms of bicycle commuters.
“You’ve got a few cars coming up and down here, but not many,” said Craig, a 65-year-old executive from a London suburb and longtime commuter. “And then the majority of people are either on bikes or walking. You wouldn’t have seen that 10 years ago, or even five years ago.”

London banned cars from around Bank station in 2017. Now only buses and black cabs can drive Oxford Street. A rebuilt Tottenham Court Road will be similar. London removed a lane of traffic from Victoria Embankment — picture Storrow Drive, only on the Thames — and did the same on other thoroughfares to create cycle superhighways that now crisscross this capital. Biking has almost become the new driving here, unleashing waves of cyclists during rush hour.
One controversial experiment made all this possible: London began charging a toll 16 years ago to drive during the workday into a small swath of downtown. The congestion fee debuted at the same time as a fleet of new buses, which offered an easy alternative to driving.
What is congestion pricing?
The idea is simple: Charge motorists during peak hours when demand for road space is greatest. Higher prices can reduce traffic by getting people to drive at off-peak hours or take mass transit. Congestion pricing can take many different forms.
Motorists pay to drive downtown at peak hours. London imposes a single charge for the day. Stockholm charges less, but drivers pay each time they pass in or out. A similar system is coming soon to Manhattan.
Toll prices automatically rise and fall with the volume of traffic. Example: Interstate 66 outside Washington, D.C., where tolls have hit $45 or more.
Tolls cost more during rush hour and less in off-peak times. Example: some of New York’s bridges and tunnels cost $2 more during peak hours, raising the toll to $12.50.
Motorists pay a toll to drive in highway express lanes. Examples: Utah, Georgia, Minnesota, California.
The tolling system now includes 650 mounted cameras that read license plates at 175 points leading in and out of a congestion zone. Motorists, at the outset of the program, paid a daily fee equivalent to $8.20 that allowed unlimited trips in and out.
The congestion charge cut car traffic by a third and allowed London to make space on its roads for other priorities. The metropolis now has 184 miles of bus lanes, 72 miles of protected bike lanes, and more room for pedestrians.
Join us live to discuss our reporting and possible solutions to Boston’s commuting crisis.
About this event“It’s the best thing that’s been done,” said Sangeeta Assomull, 60, as her dog, Loulou, chased squirrels through a mist in Hyde Park. “Fewer people come into town with their cars so the carbon emissions are better. It’s good for London transport because we all have to hop on the bus or walk or use black taxis.”
Plenty of Londoners grumble about the congestion charge, which has risen to the equivalent of nearly $15 a day while cumulatively netting more than $2.4 billion to fund transportation projects. Some argue that after an initial drop, congestion has returned, a contention refuted by the government agency Transport for London.
In 2017, London’s morning rush had 39 percent fewer people commuting by car or taxi than before the congestion charge, according to the agency’s most recent data. Public transit use remains 24 percent higher despite a recent dip in bus ridership, and the number of people biking has more than tripled to more than 40,000.

The congestion charge has not been perfect, particularly as technology evolves. Ride-hailing services such as Uber were initially exempt and soared to more than 18,000 a day. In April, they became subject to the charge and on some days their numbers dropped by more than a third. Trips by delivery vans, which have always paid the fee, also spiked with a flood of packages from online retailers.
Yet despite complaints about the cost and the lanes given over to buses and cyclists, no politician or advocacy group is pushing to dismantle the congestion zone. In fact, London’s current mayor has doubled down, adding an additional fee on older vehicles, which use more fuel and thus pollute more.
Any success of the London system is lost on the Baker administration, which released a 157-page report in August that determined a congestion charge was not even worth studying. “For those who believe that this approach reduces congestion,” Baker said at a press conference, “I suggest they read the section of the report that discusses the history of this initiative in London.”
The Baker administration never contacted Transport for London when preparing its report, according to officials in London. And the report got basic facts wrong.
It overstated the physical size of the congestion zone by nearly two-thirds and drew conclusions that British officials said they “strongly dispute.” In particular, they reject the claim by the Baker administration that the number of miles driven have “remained essentially flat.” British officials said traffic within the zone “has almost halved” since 2002.
“It really is missing the point,” Alex Williams, director of city planning at Transport for London, said of the Baker report and its conclusions. “The reality is there are far fewer cars on our roads in Central London.”
Vehicles entering the congestion zone have plummeted by 30 percent in what has been a “steady, sustained decline,” Williams said. “The congestion charge has enabled us to reimagine how we manage the streets and actually prioritize mass transit,” walking, and cycling.

Former London mayor Ken Livingstone, who launched the initiative, was less diplomatic about the Baker administration’s characterization of the congestion charge.
“They’re just lying. They’re just ignoring facts,” Livingstone said, whose new book “Livingstone’s London” described a throng of media camped outside his home on the first day of the initiative in February 2003. They came expecting to write about its humiliating failure. “And then it came into operation at 7 a.m. and within about an hour everyone had gone away because it was working.”
The Baker administration conceded it did not consult London officials in the preparation of its report. The governor said he personally “spent a lot of time with a lot of the literature,” reading about the impact of London’s congestion charge and stood by his administration’s view.
“London has had a congestion problem for a very long time and it still does,” Baker said, before putting a question to a staffer about the accuracy of their congestion report.
“Do we remember anyone from London calling and complaining?” Baker asked.
The answer: No.
In June, Baker visited London and sat in traffic, although the governor said the experience did not influence his opinion of congestion pricing. Pollack said the administration wanted to dispel the notion London had solved its traffic problems.
The London section was not in the “facts part” of Massachusetts’ traffic study, Pollack noted, but rather reflected the administration’s policy position.
“If people think that we didn’t present it accurately,” Pollack said, “no one set out for this to be the definitive research piece on it.”
The congestion charge changed the behavior of Londoners such as Craig, the executive who in September marveled at the empty intersection near Bank Station. In the old days, he would have driven into the city.
“I’d think, ‘Sod it. I’ll just take in the car today,’” Craig said. “But that’s probably 10 years ago. Now, I just don’t bother.”
A better model for Massachusetts may be farther north in Stockholm, which has a similar population and geography to Boston. On the edge of the Baltic Sea, the Swedish capital is scattered across a cluster of islands. Its medieval quarter, laced with cobblestone lanes, rivals any old city in Europe for grandeur.

A $1 to $2 congestion toll covering central Stockholm had a dramatic effect: Traffic dropped more than 20 percent the day it began as a trial in 2006 and has not returned. Like London, the fee was launched in conjunction with augmented transit that included express buses to the suburbs. The decrease in car commuters has had a surprising multiplier effect on traffic jams, according to several former and current Swedish traffic officials.
“If we lose 20 percent of the traffic in high peak hours, half of the congestion disappears,” said Peter Huledal, head of planning at the Swedish Transport Administration. “It’s not a linear curve.”
Eliminating a fraction of cars — even as little as 5 percent — can have an outsized impact on congestion, according to the US Federal Highway Administration. A small reduction in volume allows cars to move more efficiently.
Stockholm uses an overhead electronic toll system, similar to the one on the Mass. Turnpike. Unlike London’s flat daily fee, Stockholm drivers pay each time they cross in or out of downtown. The toll fluctuates by time and now hits the equivalent of $3.50 during peak rush hour, with a maximum daily charge of $11.50.

Since the congestion charge, traffic has become much more predictable, according to Sweden’s Deputy Finance Minister Per Bolund, who helped spearhead the congestion zone.
“Even car owners could see that, ‘Wow, this is actually an advantage for me,’” Bolund said in an interview in a government office near Parliament and Stockholm’s old city with its ancient buildings colored in vibrant hues of red, orange, and yellow. “Instead of being stuck in traffic jams forever and ever and never knowing how long it would take for me to get to work, now I can actually plan.’”
The roughly $1 billion in net total revenue from the congestion charge has helped build an expressway bypassing Stockholm, expand subway lines, and more.
To be sure, not everyone in Stockholm embraces the toll and traffic has rebounded on some roads outside the congestion zone. “Initially it worked well and the number of cars declined,” said Anders Edholm, 49, who clutched a briefcase as he walked past Stockholm’s famous red brick city hall. “But because of the growth of the population and the number of roadworks, we still have major problems with congestion.”

But walking up Liljeholmsbron bridge over a bay into the congestion zone, Sebastian Pettersson described how the toll reduced tailpipe pollution and raised money for roads and transit.
“I’ve never heard anyone say anything negative about it,” said Pettersson, a 28-year-old human resource officer who wore a Red Sox hat from a recent trip to Boston. “It’s just a part of us now.”
LACK OF BOLDNESS IN BOSTON
Boston’s narrow streets may evoke old Europe, but for generations the city’s attitude toward the automobile has been decidedly all-American. When Mayor Walsh pledged to dramatically curb Boston’s greenhouse gas emissions by 2050, he asked an environmental commission how to make it happen. One recommendation sparked an uproar: Charge drivers a $5 congestion fee.
Walsh swiftly dismissed the idea, telling reporters in January he was “not in favor of charging people $5 to come into the city.” The mayor even used the congestion fee as fodder for a joke, eliciting laughter during a Jan. 31 speech to business leaders.
“I don’t know how it got in there, but it got in there,” Walsh said. “I’m not supportive of that … ”
But he added a caveat: “Today.”
When Walsh announced steps last month to cut pollution, the $5 congestion charge was absent.

Pollution and congestion are inextricably linked, but for both challenges rhetoric is rarely matched by action. In many ways, Boston is moving in the wrong direction as more jobs and people and cars flock to the city.
When Walsh took office in 2014, the city pledged to cut driving 5 percent by 2020. But instead, driving has surged, jumping an estimated 14 percent from 2005 to 2017.
It is, in one sense, a good problem to have. Greater Boston is generating more of the Massachusetts economy. Last year, the metropolitan area gained 93,000 jobs as the rest of the state lost 65,000, according to data analyzed by the Massachusetts Taxpayers Foundation.
Yet while traffic proliferates, most public transportation use has dropped. The outlier is commuter rail, which has surged. But in the last five years, subway ridership has fallen 10 percent and bus ridership is down 4 percent, according to the most recent data.
“We need to change our mindset,” Walsh said in an interview, acknowledging that for the last 22 years as an elected official he has driven – or been driven – to work despite living and working close to the subway. “We want to change the culture of driving.”
Walsh defended his record, saying his administration spent several years hatching plans and was now making improvements. But progress has been slow: After six years at City Hall, Walsh has created almost three miles of bus lanes and eight miles of protected bike lanes.
“Are we going fast enough?” Walsh asked. “Our intention is to go faster.”
His administration has taken steps to challenge drivers, demonstrating that price can change behavior. The city upped parking fines and violations dropped, and it also increased meter prices in marquee shopping districts, which it says freed up more spaces. At City Hall, Walsh said, he has reduced the number of take-home cars and cut back on employee parking.
In October, Walsh sent his top transportation official, Chris Osgood, to London to better understand congestion pricing. In an interview after the trip, Walsh sounded a different tone than earlier this year, saying he “absolutely would be open to the idea” of congestion pricing, provided there was better public transportation.

The mayor expressed concern that a congestion charge could disproportionately hurt lower-income residents, but he said Beacon Hill would need to act because he couldn’t institute a congestion fee without state approval. He rejected any suggestion that the city was not open to all options.
“When it comes to an issue like transportation, I think people are willing to pay more,” Walsh said. “Congestion pricing at first would be resisted by some people, but I think [you could] explain to people that you’re going to get a better transit system out of it.”
RETHINKING BUSES
A bus roared out of Dudley Square at 8 a.m., brimming with commuters. Nearly all the passengers were Latino or black, including Sheriff Bangura, a health care administrator who emigrated from Sierra Leone and sat in an aisle seat for his commute to Back Bay.
The Route 1 is a workhorse, running from Dudley to Harvard Square, part of a bus network in Greater Boston that carries more people (387,000 average weekday ridership) than the commuter rail (123,000). On Boston’s bus system, nearly half the riders are people of color and 42 percent are low income.
They suffer unduly for congestion they don’t contribute to.
On that Wednesday, as Bangura and his fellow riders chugged into the South End, the crush of cars ground traffic to a crawl on Massachusetts Avenue.
Bangura could have walked faster.
At the wheel, driver Sevigne Pilet inched the bus forward in traffic. Pilet mused about his experience driving the Route 57 on a new bus lane on Brighton Avenue that allows him to breeze past gridlock.
“Whoever came up with that bus lane? Priceless!” Pilet exclaimed. “It’s night and day.”
Improving bus service is a relatively easy fix. Forget digging a tunnel: Service could be radically enhanced by giving buses more of the road, which would require only paint to mark off a lane and the political courage to challenge the car.
Other cities have aggressively carved out bus lanes and streets, prioritizing travel for the dozens of passengers at a time. Seattle and its surrounding suburbs have 40 miles of bus lanes. London has more than 180 miles. New York has roughly 100 miles and just designated all of 14th Street a busway, essentially banning cars.

Compare that to Greater Boston, which has about 10 miles of bus lanes. Officials here have long known what routes need help, but they have been slow to give buses priority.
To create one bus lane last year in Roslindale, the city prohibited parking each weekday morning on one side of Washington Street — a step that the mayor assumed would backfire.
“I thought there’s no way the community will want this,” Walsh said, adding that the bus lane and similar initiatives that eliminated parking spots have been largely embraced. “It’s convincing people that it’s not that bad and that these will make improvements.”
The City of Everett was a surprising pioneer in prioritizing buses. In December 2016, Mayor Carlo DeMaria’s administration launched a bus lane down Broadway that eliminated some 200 parking spots each weekday morning. Bus trips down the thoroughfare have sped up 30 percent, officials said.
“A bus with 50 people should have priority over one car,” DeMaria said.
This fall, Somerville went even further, taking away a travel lane in each direction on Broadway and designating it for buses. The shift sparked small but vocal protests, with one man’s sign urging residents to, “Call City Hall.”

Somerville Mayor Joseph Curtatone has stood firm. “If we want to get people out of their cars, we have to make public transportation the easy choice,” Curtatone said.
Ariella Green rode the Route 89 bus as it whizzed down Broadway in Somerville, passing cars stuck in traffic. The bus-only lane cut Green’s commute by 15 minutes, but she also felt for drivers.
“I feel like it’s great for a bus,” said Green. “But that doesn’t matter if you’re in a car.”
Directly behind her, Karen Van Dyne piped up: “Anything that makes public transit better will make fewer people take cars.
“Ultimately Boston has the worst traffic in the country, and we have to do something about that,” Van Dyne said. “And buses are the cheapest and easiest solution.”
Spotlight reporter Andrew Ryan can be reached at [email protected]. Tips and comments about this Spotlight series can be sent to [email protected].

The Globe worked with StreetLight to assess traffic intensity in major Boston neighborhoods. The San Francisco-based firm, which specializes in transportation analytics, collects its data and generates metrics through its platform that uses sources that include anonymized location records from opted-in smartphone apps and vehicle navigation devices. The metrics have been validated using thousands of North American traffic counters, including more than 330 installed by the Massachusetts Department of Transportation. The metrics describe aggregate groups of travelers, not individuals. Neither StreetLight nor the Globe can identify individual users or devices.
For congestion maps, StreetLight used more than 1.5 million sample trips recorded from mobile devices on every Tuesday, Wednesday, and Thursday of June 2018 to measure typical traffic on roads in greater Boston. The colors represent the degree to which drivers caught in traffic moved slower than the highest recorded average speed on that road segment for those days. When there is little to no traffic, vehicles moved between 81 and 100 percent of the highest average speed ; between 61 and 80 percent of highest average speed during light traffic ; between 41 and 60 percent of highest average speed during moderate traffic ; between 21 and 40 percent of the highest average speed during congestion ; and between 0 and 20 percent of the highest average speed during heavy congestion .

