

Where do the 2023-24 Celtics stand among the greatest teams in NBA history?
If Jayson Tatum and Jaylen Brown carry the team to Banner No. 18, their legacies would be cemented. But all of this year’s success means nothing without a ring.
Most of the stakes for the 2023-24 Celtics are now as obvious and familiar as they are irresistible to dream on.
With four more victories, the Celtics will be NBA champions for the first time since 2007-08. It’s fair, by the franchise’s lofty historical standards and the 21st century demands of Boston sports fans, to suggest they are overdue.
There have been 15 unfulfilled seasons since the collection of Banner No. 17. That ranks as the second-longest championship drought in franchise history, after the 21-year void from the cherished 1986 title until Paul Pierce, Kevin Garnett, and Ray Allen united in ubuntu to capture that ’08 crown.
A championship this year also would stand as a culmination or a confirmation in other meaningful ways.
It would terminate the narrative that Jayson Tatum, and to a slighter degree Jaylen Brown, are incapable of being the premier players on a championship team.
Key metrics
Throughout this article, advanced basketball metrics are used to compare teams across multiple decades of the NBA. Click on for more information on their meaning and how they are calculated.
It would enhance the Hall of Fame candidacies for veterans Al Horford and Jrue Holiday.
It would make their five trips in the previous seven seasons to the Eastern Conference finals — without a championship — feel like a necessary part of the process rather than opportunities left unfulfilled.
And yet these Celtics are playing for even more than the aforementioned high stakes. They’re playing for a place in history. Championships are forever, but there is an additional level of achievement within their reach.
This is a quest for the Celtics to take a permanent place among the NBA’s all-time best.
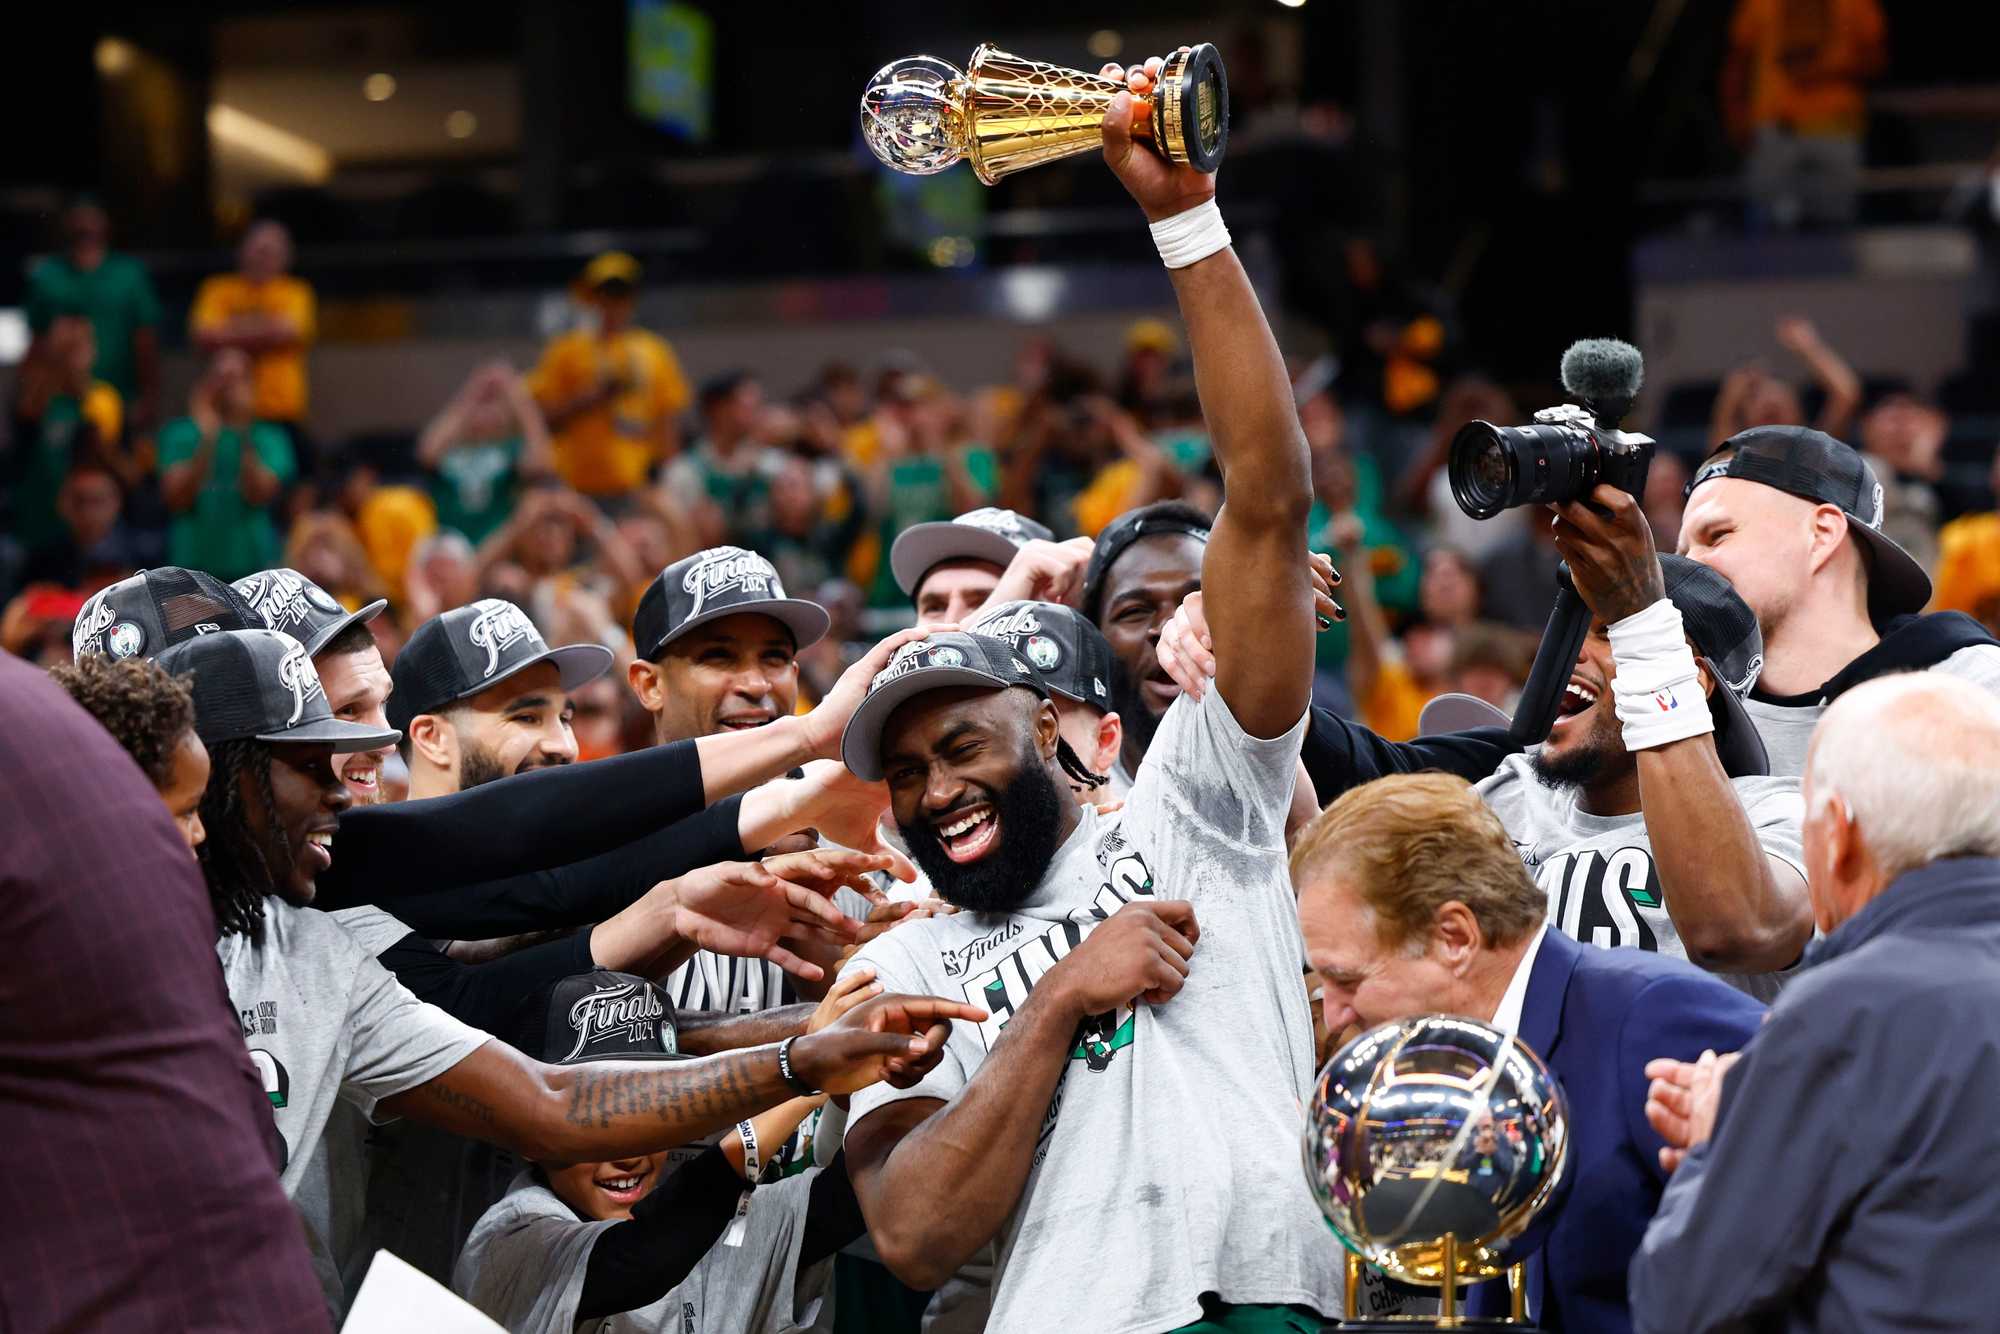
This project is designed as a companion to that quest, an examination of how, through the long regular season and three rounds of the playoffs, the Celtics have already gone about building a foundation to be considered one of the best single-season teams in league history.
Objectively, we’ll dive into the reams of data that suggest these Celtics are truly extraordinary, a team of uncommon prowess on both ends of the court. A few achievements of note:
· They had the highest offensive rating (122.2 points per 100 possessions) since the NBA began documenting full play-by-play in 1997-98.
· They had the second-lowest defensive rating in the league (110.6), and their 11.6 net rating tied the 2016-17 Warriors for third-best in NBA history, behind two of Michael Jordan’s Bulls teams.
· They scored the most points in the Celtics’ storied history (9,887).
· They won 10 games by 30 or more points, tying the 1971-72 Milwaukee Bucks for the most all-time. They won a record three games by 50 or more points.
· They won their first 20 home games, and later had an 11-game overall winning streak in which they outscored opponents by an average of 22.1 points.
· They went 64-18 in the regular season, the first team since the 1975-76 Warriors to finish at least 14 games ahead of the runner-up in their conference.
Advertisement
The benchmarks for legendary status are established in the data. But we’re giving the subjective full consideration here too.
National NBA writer Gary Washburn, Celtics beat reporter Adam Himmelsbach, columnist Chad Finn, and columnist/commissioner emeritus Bob Ryan convened to write about and discuss what they consider the 19 best NBA teams of all time, what made them special, and where these Celtics might fit into that landscape.
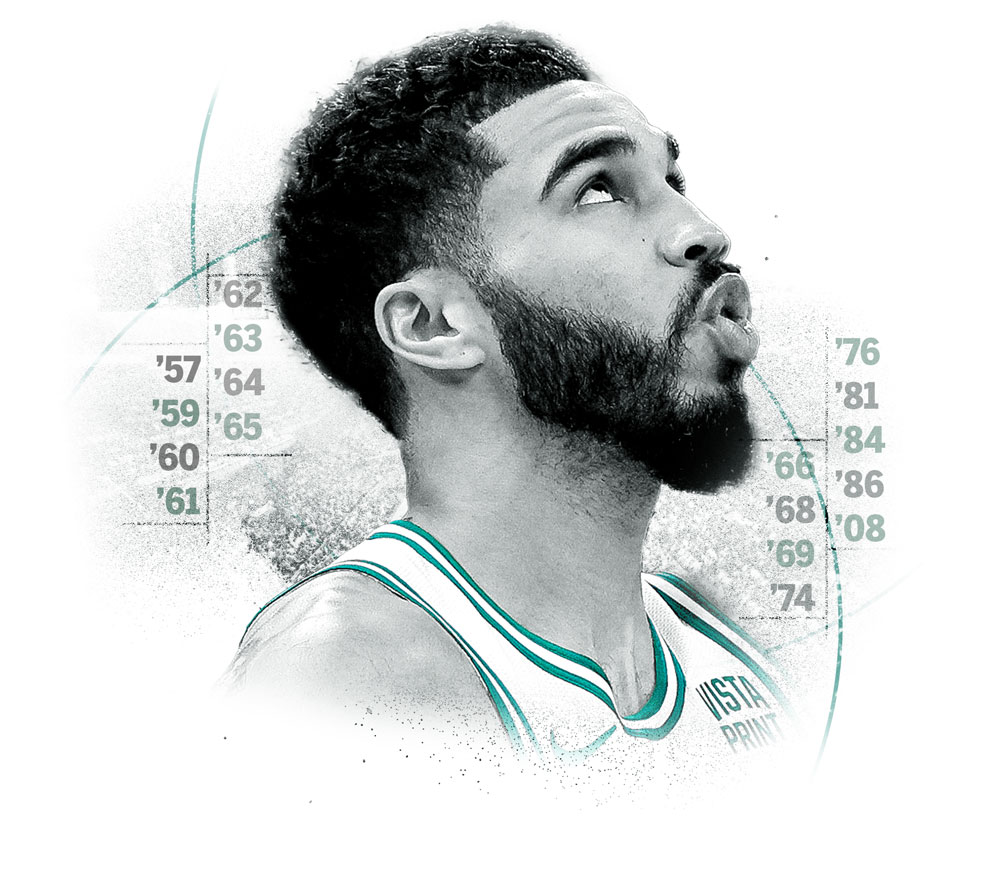
The list includes six Celtics teams: 1962, ’65, ’74, ’81, ’86, and ’08. All won the NBA championship.
To join them among the elite of the elite, these Celtics of course must become champions too.
Their entire season so far has been a flashing green signal that they not just can be champions, but ought to be.
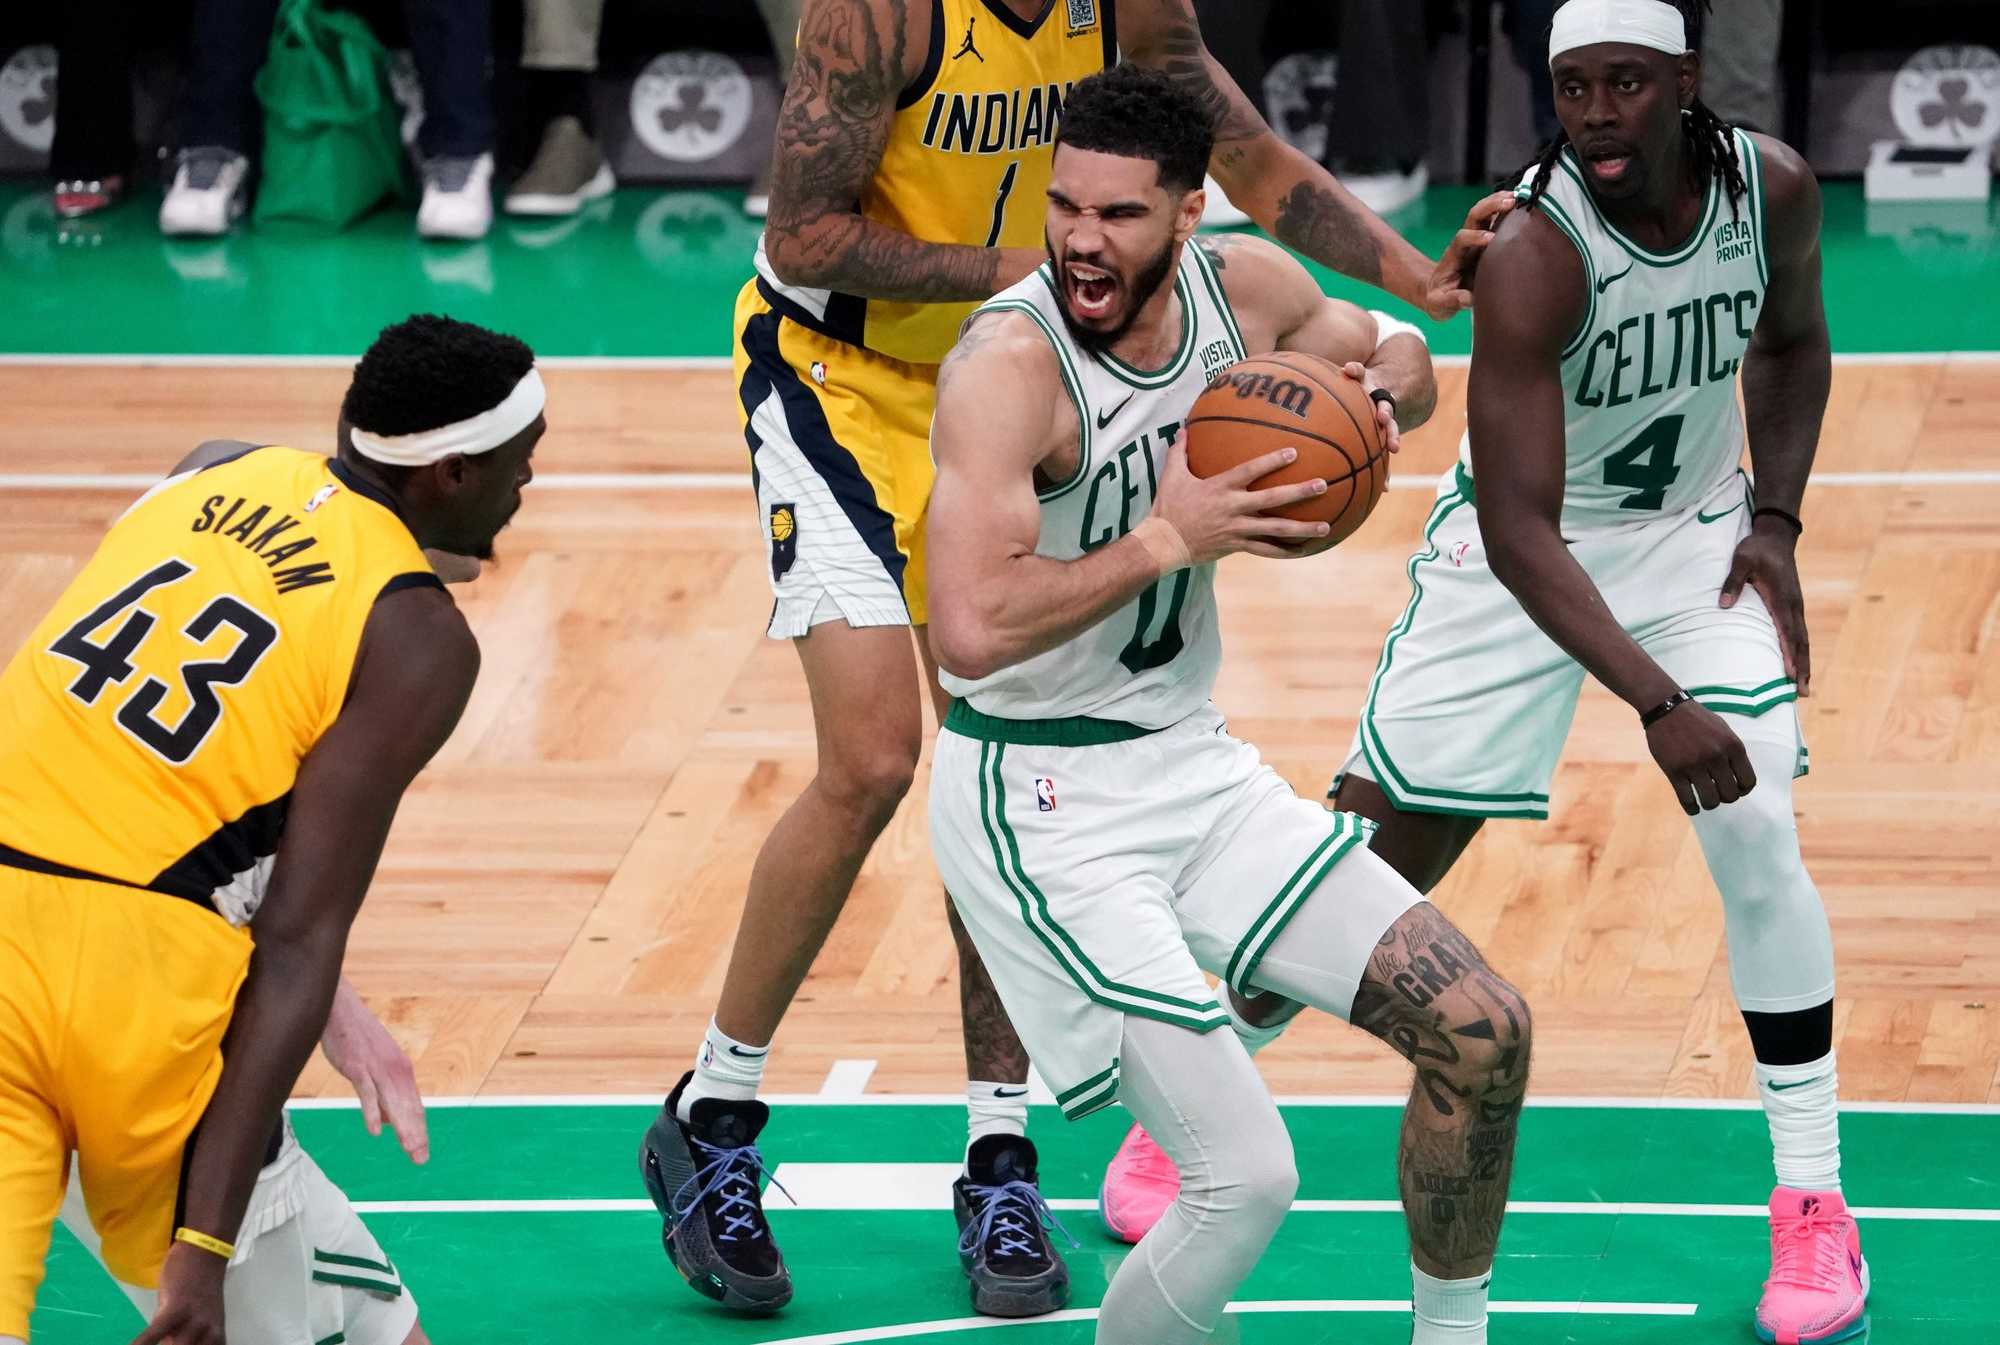
Skeptical that the Celtics are en route to legendary status? That’s understandable to some degree, especially if you never miss a game and therefore are all too familiar with their rare but recurring flaws, such as late-game offensive execution.
Familiarity doesn’t necessarily breed contempt, but it sure does lead to an overabundance of nitpicking.
That’s where the objectivity of the advanced metrics can help. The numbers, fully crunched, serve as a reminder — perhaps a necessary one — that the 2023-24 Celtics have been historically excellent across a range of metrics, and their aptitude on offense and defense has rarely been matched.
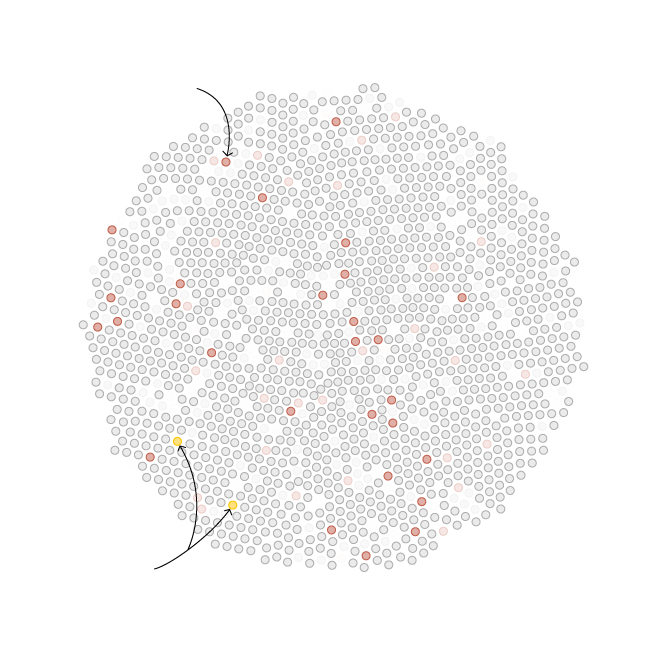
Consider the individual comparison graphics here of the league’s greatest teams. The Celtics rank in the 99th percentile among all teams since 1960 in Pythagorean Win Percentage, offensive rating, and Simple Rating System, and in the 85th percentile in defensive rating.
Only four of the greatest teams on our list match the current Celtics by ranking in the 99th percentile in three categories: The 1970-71 Bucks, who rank 92nd in the fourth, defensive rating; the 72-win 1995-96 Bulls, who were in the 96th percentile in defensive rating; the Bulls again the following year, finishing in the 90th percentile in defensive rating; and the anything-is-possible 2007-08 Celtics, who were 79th in offensive rating.
Talk about extraordinary company. Here’s a look at the greatest teams of all time, as chosen by the Globe staff, and how they compare with this year’s Celtics.
How the 2024 Celtics stack up against the league’s greatest teams
The Celtics ranked in the 99th percentile of all teams since 1960 in , , and , and in the 85th percentile in , making them one of the best teams ever from an advanced statistics standpoint. Use the dropdown below to view additional teams or .
The NBA schedule was expanded to 80 games, so naturally the four-time champion Celtics had to celebrate by becoming the first team to win 60 games. This was the first Celtics squad in 10 seasons without Hall of Famer Bill Sharman in the starting lineup, but he was ably replaced by future Hall of Famer Sam Jones, who averaged 18 points a game. Did someone say “Hall of Fame”? This squad featured no fewer than eight of them, including veteran pick-up Carl Braun and contributor Tom “Satch” Sanders. The playoffs were a grind. The Philadelphia Warriors and Los Angeles Lakers each took them to a Game 7. Jones’s jumper at 0:02 gave them a 109-107 triumph over Philly. Against LA, it came down to a famous left baseline miss at the regulation buzzer by Frank Selvy. No worries. Bill Russell took charge in the OT, finishing with a playoff career-high 30 points and 40 rebounds. Yes, 40. Final: Boston 110, LA 107. — Bob Ryan
Advertisement
The common perception is that the superpower of this year’s Celtics is the quality and versatility of their starting five. And you know what? It’s true.
Jayson Tatum and Jaylen Brown are the All-NBA candidates, prolific scorers who have committed to mastering other aspects of the game as they’ve matured. Derrick White and Jrue Holiday are lockdown defenders, selfless offensive players, and the team’s most trustworthy decision-makers. Kristaps Porzingis is the cheat code, capable of knocking down a long 3-pointer or getting an easy bucket almost on command in the paint.
What sometimes goes unnoticed is that the production runs deeper than the starting five. Historically deeper, actually. The Celtics are just one of eight teams since 1960 to have eight qualifying players finish with 0.100 or more win shares per 48 minutes.
The eight: Porzingis (.226), Tatum (.189), Al Horford (.172), White (.171), Payton Pritchard (.160), Sam Hauser (.134), Holiday (.133), and Brown (.121). Luke Kornet, whose WS/48 was .243, didn’t reach the 1,500-minute threshold to qualify.
The other seven teams to achieve this? The 1985-86 Lakers, 1992-93 and 1993-94 SuperSonics, 2001-02 Kings, 2003-04 Pistons, 2009-10 Magic, and 2013-14 Spurs.
Dean Oliver, author of the 2004 book “Basketball on Paper” and a trailblazer in basketball analytics, sought to answer the sport’s most important and complicated question: How do teams really win games?
In his pursuit of insight through data, Oliver pinpointed what he called the “Four Factors of Basketball Success.” They are shooting, turnovers, rebounding, and free throws, with each given a different weight correlating to their importance.
Shooting, the most important, factors in at 40 percent, while free throws count for just 15 percent.
Over the last two decades, Oliver’s “Four Factors” have consistently identified the league’s elite teams. And again, the 2024 Celtics find themselves in the company of the all-time best.
Only five NBA champions have ranked higher than the Celtics in both offensive and defense four factors: Four of the ’90s dynasty Bulls teams (1990-91, 1991-92, 1995-96, and 1996-97) and the loaded 1982-83 Sixers, who featured four Hall of Famers (Julius Erving, Moses Malone, Maurice Cheeks, Bobby Jones) along with legendary Celtics tormentor Andrew Toney.
2024 Celtics excelled at keys to success
The 2024 Boston Celtics completed one of the best seasons since 1974 as measured by the : shooting, turnovers, rebounding, and free throws. Relative to their in-season competition, only 10 teams ranked higher than this year’s Celtics in both offensive and defensive four factors.
Combined offensive four factor score: 0.0
Combined defensive four factor score: 0.0
Net rating, or a team’s point differential per 100 possessions, is probably the most frequently cited advanced metric, and for good reason: It’s easily accessible, and it tells you a lot.
And what does it tell us in regard to the 2023-24 Celtics? The same thing the aforementioned metrics do — that these Celtics reside in the neighborhood of the league’s all-time finest teams — but perhaps in the most impressive way of all.
As noted in the introduction to this project, the Celtics’ 11.6 net rating is tied with the 2016-17 Warriors of Steph Curry, Kevin Durant, and Klay Thompson for third-best in NBA history.
Only back-to-back Jordan-era Bulls teams from 1995-96 (13.4) and 1996-97 (12.0) check in higher.
One surprise to us: The 1985-86 Celtics — who in our corner of the map would run away with a ranking of the greatest team in NBA history — don’t fare all that well analytically, at least compared with the Bulls and Warriors dynasties. The ’86 Celtics have the 22nd-best net rating of all time, at 9.2.
Celtics dominant on both sides of the ball
The 2024 Celtics finished with the fourth highest net rating since 1960, which measures a team’s point differential per 100 possessions. Team labels indicate season leaders, , and points above the next highest team.
Net rating: 0
Behind season leader: 0.0
Advertisement
So are we getting slightly ahead of ourselves? Well, sure.
To be clear, we’re not crowning the Celtics yet. They must prevail in these Finals. They must win it all, or those narratives about what they still have not achieved will grow louder than before.
Still … it is irresistible to ponder what they are so close to being. With a Finals victory, the conversation regarding whether Tatum and Brown can front a championship instead becomes how many championships they can win.
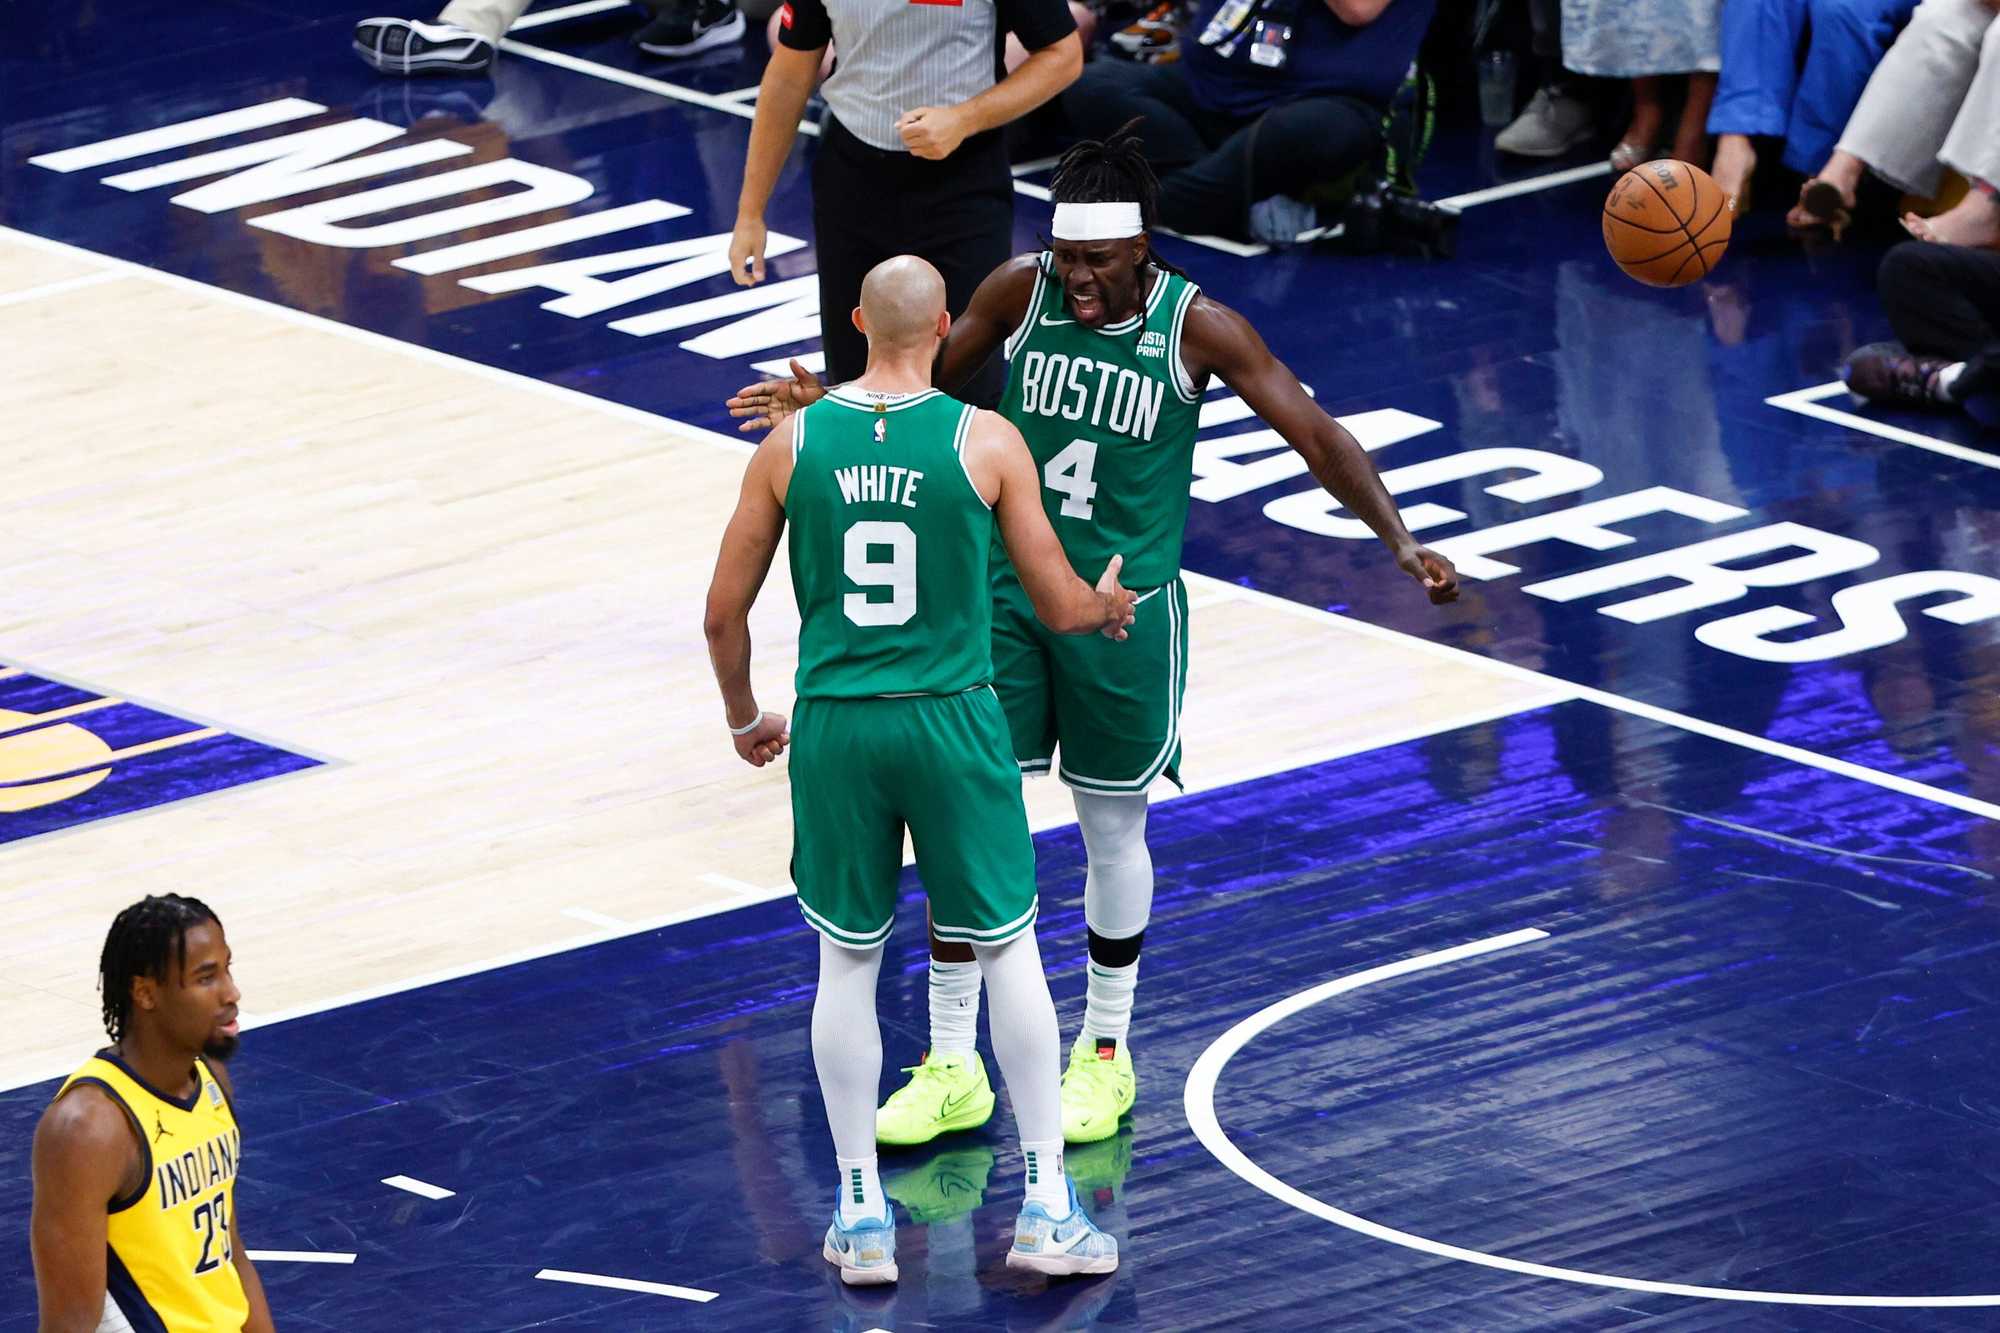
Holiday and White, or maybe Porzingis and Horford, will become beloved in Boston in the way that only champions can be.
We’ll talk about them as we do Dennis Johnson and Cedric Maxwell and Sam Jones and Jo Jo White, superb players who enhanced their standing in Boston sports lore by delivering in the biggest moments.
Should the Celtics win it all, no serious person will whine about them taking an “easy” route through the playoffs, just as no one ever notes that the 1981 Celtics’ opponents in the Finals were the 40-win Houston Rockets. The destination matters, not the path.
And one more thing — the most important thing.
Should the Celtics win it all, they will absolutely belong in the conversation as one of the handful of greatest single-season teams in NBA history.
The data and analytics already tell us that they are. Now it’s up to the Celtics to tell us that they are as well, by confirming it on the court.
Methodology
· Team-to-team comparison: In an effort to compare NBA teams across eras, we ranked each team season from 1960 through 2024 in four metrics: Pythagorean win percentage, offensive rating, defensive rating, and simple rating system. For Pythagorean win percentage (an estimate of wins and losses based on points scored and allowed) and simple rating system (margin of victory/strength of schedule rating), each team was ranked against all other teams from that time period.
But to account for differences in rules, style, and pace of play, offensive rating and defensive rating (estimates of points scored or allowed per 100 possessions) were simplified to a scale where 100 is considered league average for each season. A team that was 10 percent better than league average in a given year would earn a score of 110. These simplified ratings based on seasonal context were then ranked against all other team seasons over the same time period.
Each team was then assigned a percentile rank based on each of its four scores, noting the percentage of other teams that finished below their score.
· Four Factors of Basketball Success: To quantify how strong teams are both offensively and defensively, we ranked team seasons using the Four Factors, key metrics that correlate closely with winning basketball games. The system, developed by “Basketball on Paper” author Dean Oliver, relies on shooting, turnovers, rebounding, and free throws to measure the likelihood of team success.
As we did with offensive and defensive ratings, we also rated teams on a simplified scale (where 100 is equal to league average) for each of these four metrics as they related to the other teams in their individual seasons. Those simplified scores were then weighted according to Oliver’s assigned weights and averaged into one overall score each for offense and defense. Only teams from 1974, the first year all four metrics were tracked, through 2024 were included.
For formulas for Pythagorean win percentage, offensive and defensive rating, simple rating system, win shares, four factors, net rating, and other advanced statistics, check out Basketball-Reference.com’s glossary.
Top photo illustration by John Hancock/Globe staff. Source images by Erin Clark/Globe staff, Danielle Parhizkaran/Globe staff, Associated Press file photos, Getty Images, and Adobe Stock Images.
Credits
- Reporter: Chad Finn
- Contributors: Adam Himmelsbach, Bob Ryan, and Gary Washburn
- Editors: Katie McInerney
- Photo editors: Colby Cotter and Leanne Burden Seidel
- Design, Development, Data Anaylsis, and Graphics: John Hancock
- Copy editor: John Carney
- Quality assurance: Nalini Dokula and Todd Dukart
© 2024 Boston Globe Media Partners, LLC
