Beyond the gilded gate

A Boston Globe Spotlight Report
into the Massachusetts housing crisis

Illustration
Illustration

Published October 13, 2023

Single-family home price index

010x8x6x4x2x12x1980198519901995200020052010201520202023Base 1980
  • US
  • Massachusetts
  • New York
  • Washington
  • California
  • Hawaii
US
Massachusetts
From 1980, 6x higher
From 1980, 11x higher

1980:Q1 = 100, all-transactions, not seasonally adjusted.

Home prices have risen nationwide, particularly since the pandemic. By one measure, the cost of a home is now six times higher than it was in 1980.

But in Massachusetts, prices have skyrocketed. The cost of a single-family home is 11 times higher than in 1980.

Massachusetts even beats out other expensive states like New York, Washington, California, and Hawaii when it comes to rising costs.

House Divider

Household income vs. home prices

  • Mass. median household Income
  • Mass. single-family homes median sale price
  • Mass. condos median sale price
$0$600,000$400,000$200,0001990199520002005201020152020
2023: $600,000
2023: $525,000
2022: $93,550
Percent change from 1987 to 2022:
+190%
Percent change from 1987 to 2023:
+295%

2023 home and condo prices are year-to-date figures as of August 2023. Median household income is in current dollars, not seasonally adjusted. Figures are for the entire state of Massachusetts.

Now compare that to income, which has risen more slowly. In Massachusetts, median household incomes rose from $32,240 in 1987 to $93,550 in 2022.

The result is a huge affordability gap for both single-family homes and condos.

House Divider

Buying a home is increasingly out of reach, especially in Greater Boston

Boston metro median income:
$104,000
Income needed:
$300,000

Income figures are for census-designated metropolitan statistical area (Boston-Cambridge-Newton, MA-NH)

A typical household in the Boston metro area now makes about one-third the income needed to afford the typical single-family home in Greater Boston.

The median single-family home price hit a record high of $910,000 this year in Greater Boston, an area roughly inside Interstate 495. To afford that, a household would need an annual income of at least $300,000.

House Divider

Black and Latino owners are cost burdened at higher rates

Low-income families and families of color in Greater Boston have felt this affordability crisis the most.

Black and Latino households are half as likely to own a home as white households, and those that do are cost burdened at disproportionate rates.

SOURCES: 2014-2018 HUD Comprehensive Housing Affordability Strategy, Greater Boston Housing Report Card 2022, produced by the Boston Foundation

House Divider

Homeowner vacancy rates by metro area

Why is this happening? A lack of supply. The Boston metro area has one of the nation's lowest vacancy rates — an indication supply is extremely tight.

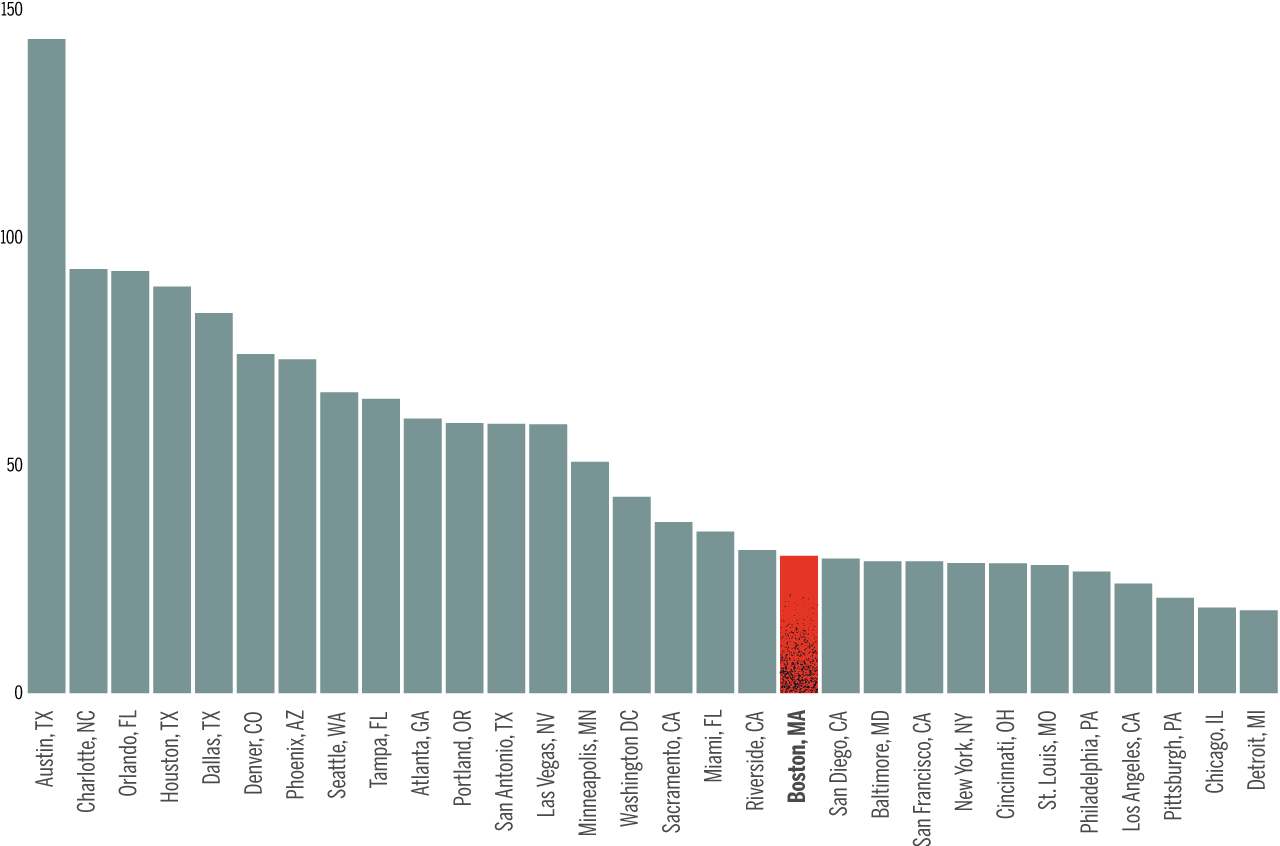
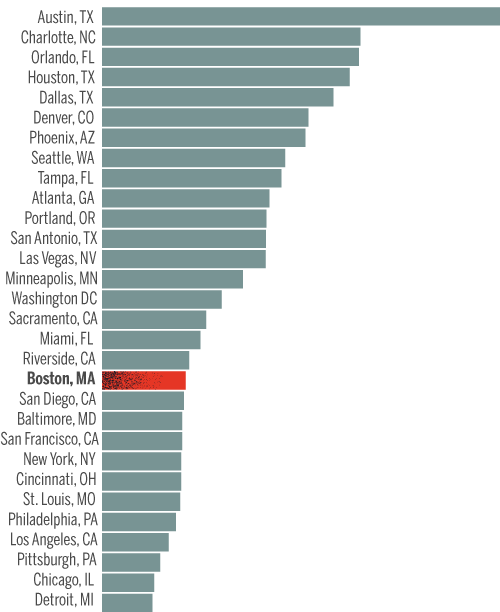
Greater Boston isn't producing the housing units needed to meet demand. The region issued fewer housing permits per capita than many major metros.

House Divider

Permits issued per 1,000 people by metro area

Permits issued per 1000 peoplePermits issued per 1000 people
Boston metro
permits per 1,000:
29.9
Austin metro
permits per 1,000:
142.6

Figures are for census-designated metropolitan statistical areas

Since 2012, the Boston metro area authorized about 30 new residential building permits per 1,000 people.

Compare that to Austin, Texas, which issued nearly five times as many.

Bold solutions are at play to address this crisis. But is everyone on board?

House Divider

Advertisement

Credits
  • Reporters: Mark Arsenault, Andrew Brinker, Catherine Carlock, Stephanie Ebbert, Diti Kohli and Rebecca Ostriker
  • Editors: Patricia Wen, Tim Logan, Mark Morrow
  • Photographers: Lane Turner, Jessica Rinaldi, Erin Clark, Craig F. Walker, Pat Greenhouse, David L. Ryan, Jonathan Wiggs
  • Photo editors: Leanne Burden Seidel and Bill Greene
  • Video producers: Olivia Yarvis, Randy Vazquez, and Dominic Smith
  • Video director: Anush Elbakyan
  • Design: Ryan Huddle
  • Development, graphics, and data analysis: Daigo Fujiwara
  • Development: John Hancock, Andrew Nguyen
  • Digital editor: Christina Prignano
  • Copy editor: Michael J. Bailey
  • Quality assurance: Nalini Dokula
  • Audience: Cecilia Mazanac and Jenna Reyes
  • SEO: Ronke Idowu Reeves
  • Newsletters: Jacqué Palmer
  • Researcher: Jeremiah Manion