Beyond the gilded gate
A Boston Globe Spotlight Report
into the Massachusetts housing crisis


Published October 13, 2023

Permits issued per 1,000 people by metro area
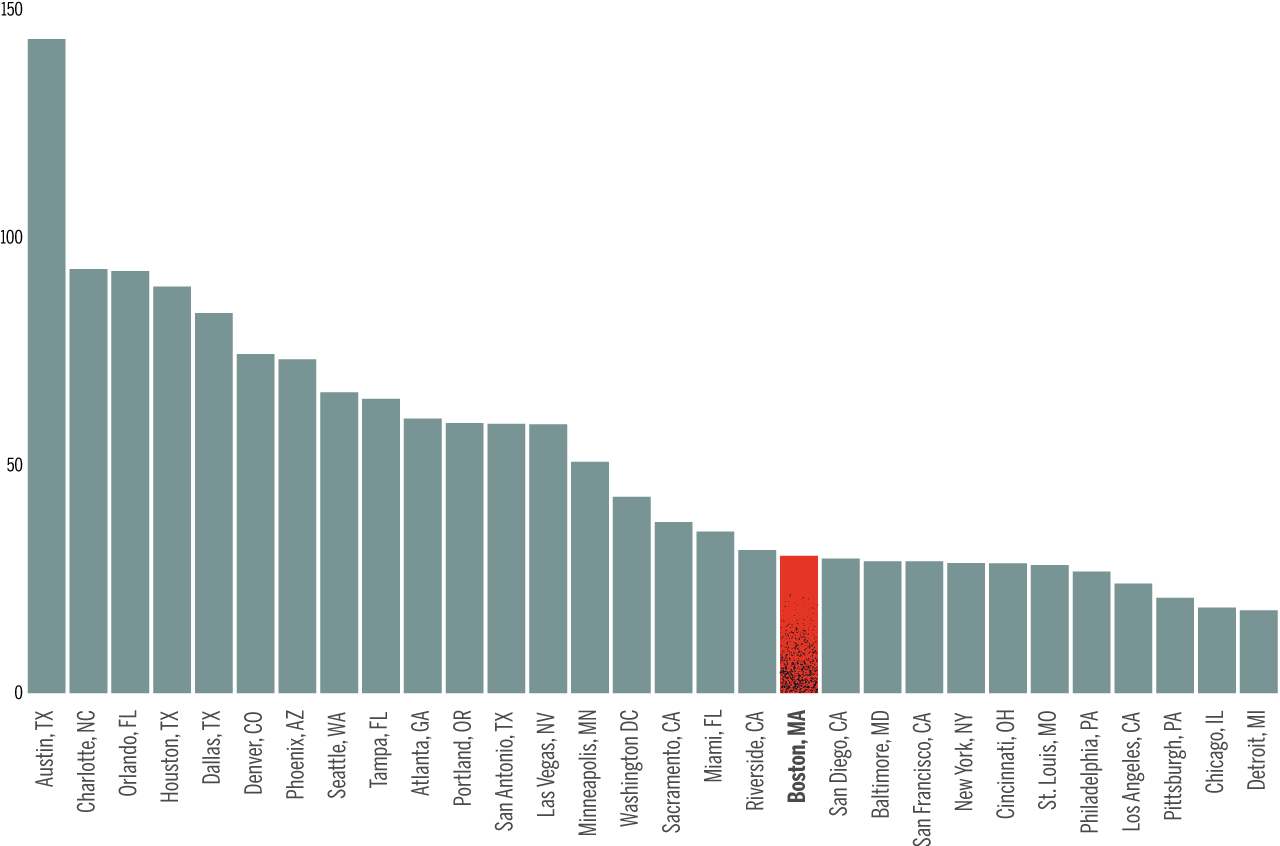
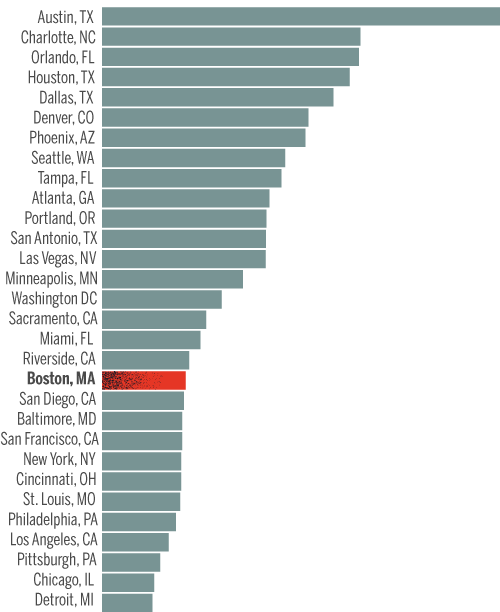
Boston metro
permits per 1,000:
29.9
permits per 1,000:
29.9
Austin metro
permits per 1,000:
142.6
permits per 1,000:
142.6
Bold solutions are at play to address this crisis. But is everyone on board?
Beyond the gilded gate
People in and around Boston are being challenged, in ways never before, to address the region's unprecedented housing crisis. The Globe Spotlight Team probed this question and found yet another crisis: One of consensus and will.

Preview: Data
Graphics: Why it’s so hard to afford housing in Boston

Part 1: Milton
In towns like Milton, home prices are a threat to prosperity. But they don’t have to be
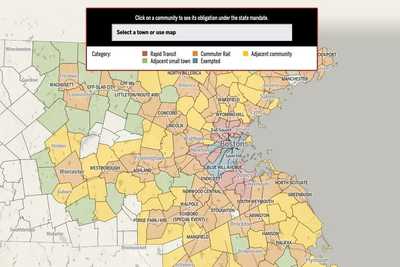
Map
How will the state’s historic rezoning mandate affect your community?

Part 2: Generations
One house, one family, and the fading dream of homeownership

Part 3: Luxury towers
Reckoning with Boston’s towers of wealth

Part 4: Brookline
An identity crisis comes to Brookline

Part 5: Single-family zoning
Reimagining an American ideal

Part 6: The renters
A Boston building, scattered souls, and rent control revisited

Part 7: Construction costs
The $600,000 problem. Why does it cost so much to build housing in Boston, and what can we do about it?

Calculator: Construction costs
Calculator: Penciling out a project
Advertisement
Credits
- Reporters: Mark Arsenault, Andrew Brinker, Catherine Carlock, Stephanie Ebbert, Diti Kohli and Rebecca Ostriker
- Editors: Patricia Wen, Tim Logan, Mark Morrow
- Photographers: Lane Turner, Jessica Rinaldi, Erin Clark, Craig F. Walker, Pat Greenhouse, David L. Ryan, Jonathan Wiggs
- Photo editors: Leanne Burden Seidel and Bill Greene
- Video producers: Olivia Yarvis, Randy Vazquez, and Dominic Smith
- Video director: Anush Elbakyan
- Design: Ryan Huddle
- Development, graphics, and data analysis: Daigo Fujiwara
- Development: John Hancock, Andrew Nguyen
- Digital editor: Christina Prignano
- Copy editor: Michael J. Bailey
- Quality assurance: Nalini Dokula
- Audience: Cecilia Mazanac and Jenna Reyes
- SEO: Ronke Idowu Reeves
- Newsletters: Jacqué Palmer
- Researcher: Jeremiah Manion
© 2024 Boston Globe Media Partners, LLC